Twitter users and their online behaviour are objects of the survey Tweeting in everyday life. This post reveals basic descriptive information about the Twitter users, who took part in the survey, but I’m already working on discovering patterns in the data, that reveal different types of tweeting subjects, such as “self-narrators”, “super tweeps”, “negativists” or “reactionists” and their habits. Nevertheless, let’s see first where they come from and with whom and about what they prefer to tweet …
507 Twitter users took part in the survey Tweeting in everyday life and generously shared information about how, how often, when, where, with whom, about what etc. they tweet. Respondents were engaged on Twitter by retweeting the survey’s web address. 392 of them answered enough questions to became part of the convenience sample.
29 countries
Respondents come from 29 countries with the largest share of 38% from Slovenia, 17% from Germany, 15% from the UK and 11% from the USA. Other countries where respondents of the “Tweeting in everyday life” dwell are Argentina, Armenia, Azerbaijan, Australia, Austria, Belgium, Canada, Croatia, Ecuador, Finland, India, Ireland, Italy, Japan, Lebanon, Netherlands, New Zealand, Saudi Arabia, Serbia, Spain, Sweden, Syria, Turkey, UAE and Venezuela. — It’s a nice nice reflection of where my followers have their followers. We definitely have excellent connections at home in Germany and among Brits and Americans!
Employed, women and with regular incomes
Users from the survey revealed about themselves, that 59% are female and 41% male. 78% of them have regular incomes. 75% are employed, self-employed, contract workers or freelancers, 18% are students, less than 6% unemployed and 1% already retired.
Comparing this sample structure to the unemployment rates in Europe or America, the 6% unemployed among the participants of the Tweeting in everyday life is less than in the EU28 with 11% unemployment rate in 2013 or in the US where the unemployment rate at the end of 2013 was 7%. — Anyhow, this is just a comparison and we must not assume that the unemployment rate among the tweeting population (all Twitter users) equates to the demographic structure of this accidental sample.
They tweet about themselves …
16 conversational topics were listed and each user could pick 3, which she prefers to tweet about the most and then ranked them according to her preferences. The topic user prefers the most was ranked as 1st, the second preference as 2nd and the third most preferred topic user ranked on the 3rd place.
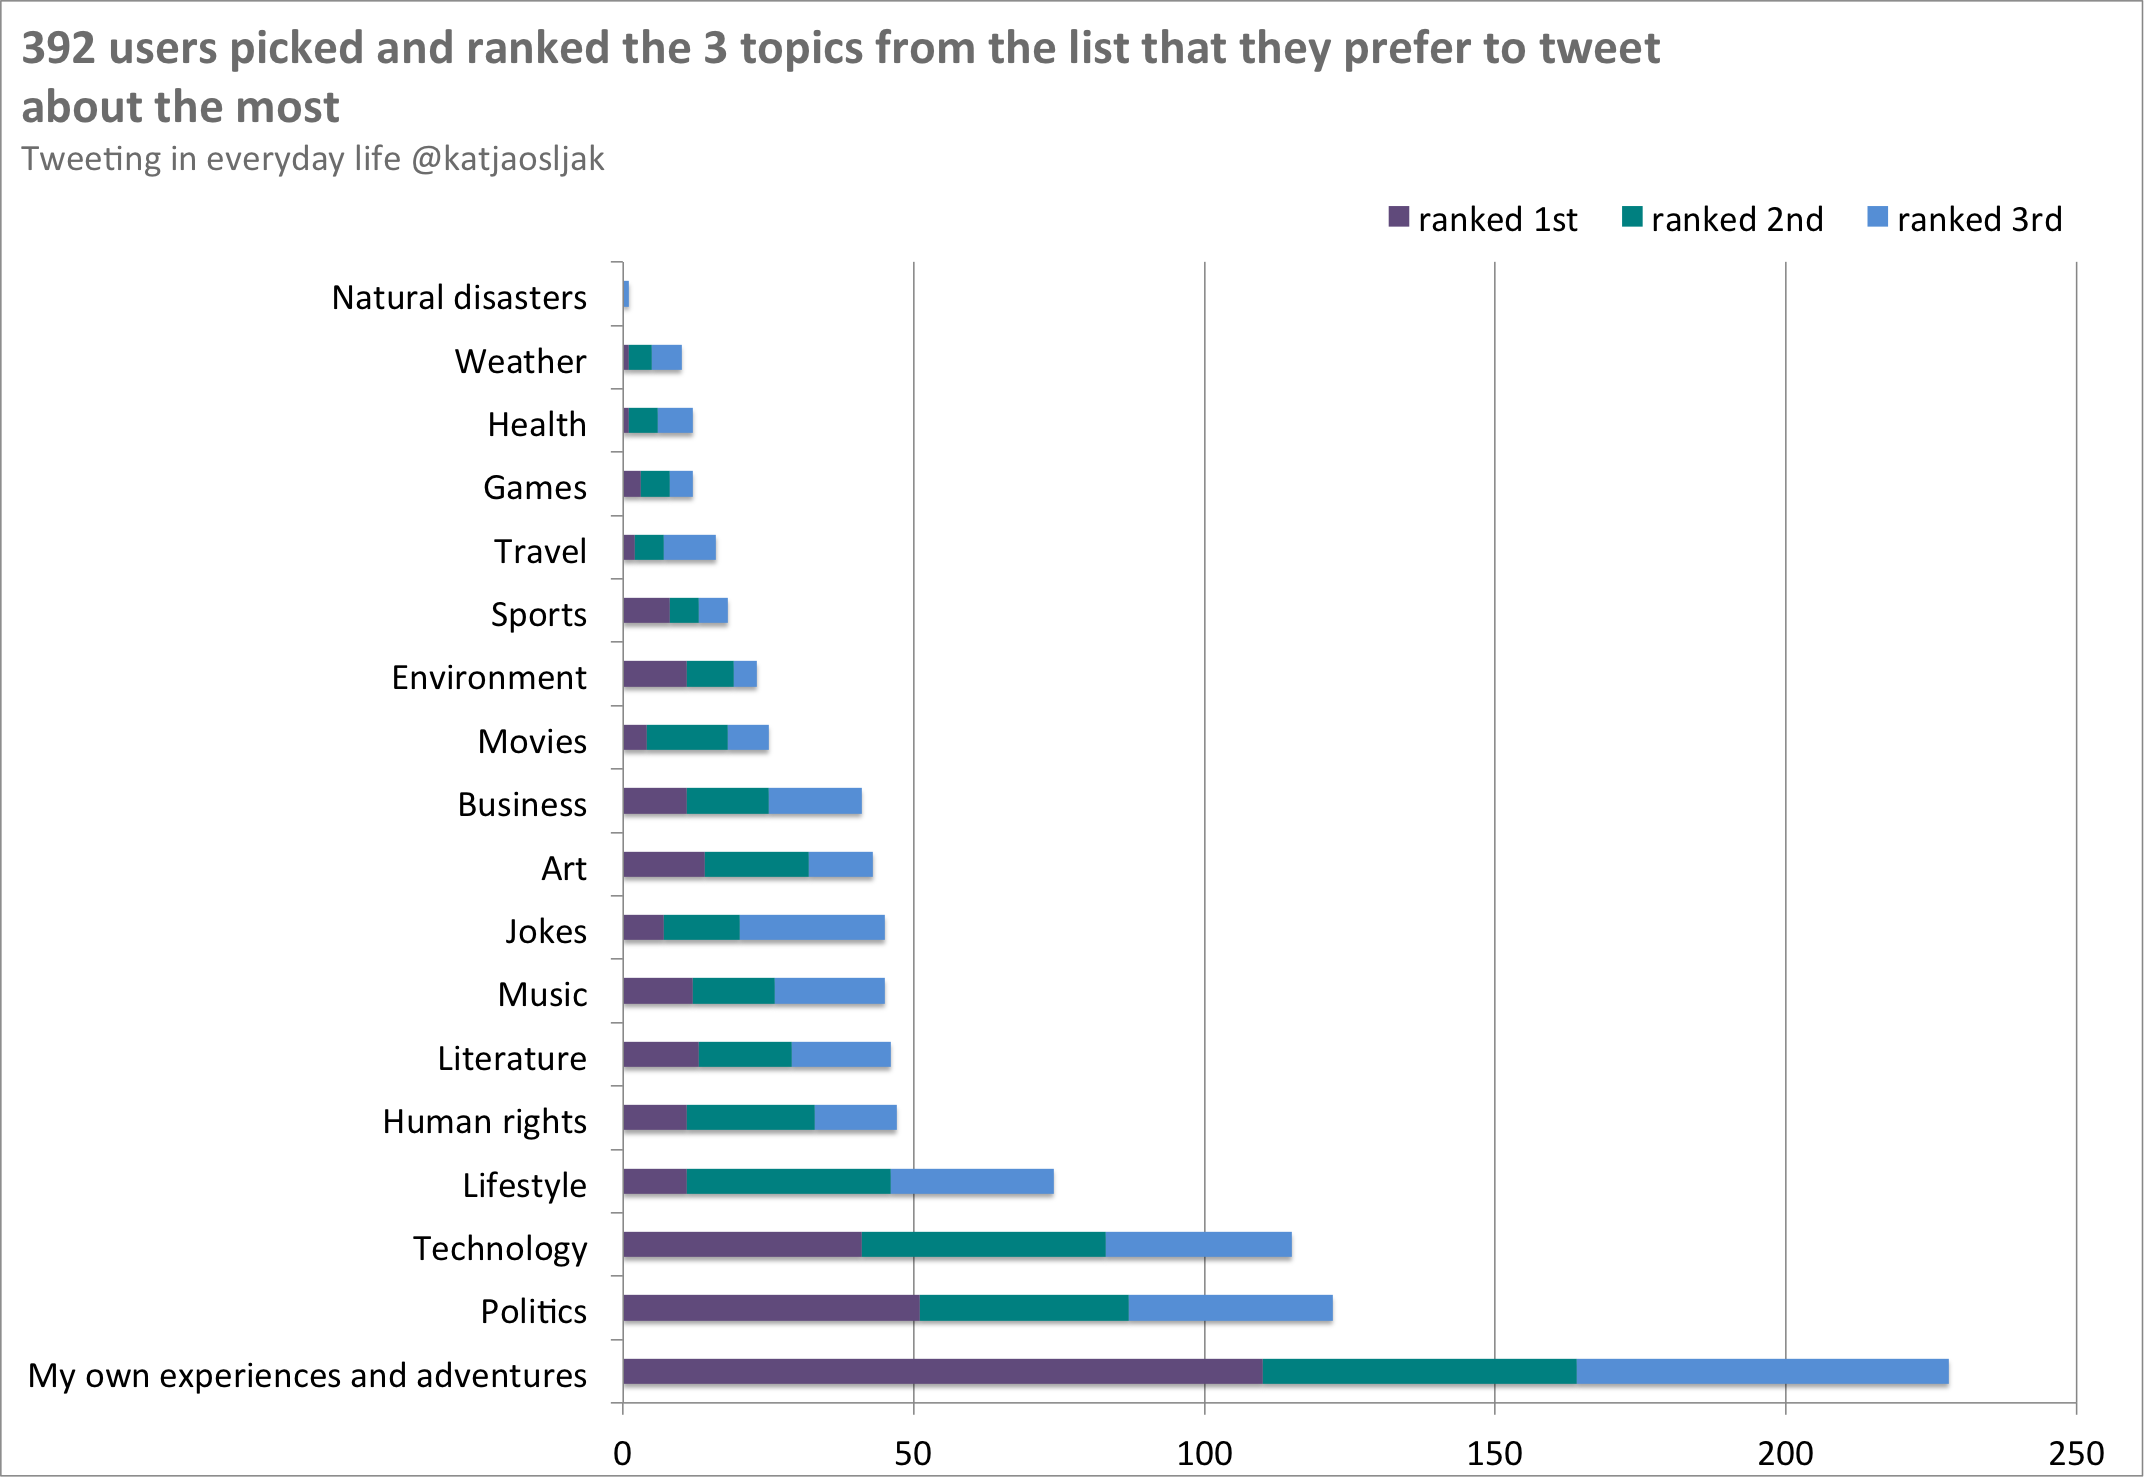
A basic analysis shows, that 58% users prefer to tweet about their own experiences and adventures and pronouns I, me, my, mine or myself seem to be used frequently on Twitter!
… with their friends
Here 18 user profiles or types of their backgrounds have been listed and the respondents were asked again to pick the 3 they engage the most on Twitter and rank them. Same mechanics was used as for picking and ranking topics in the previous case.
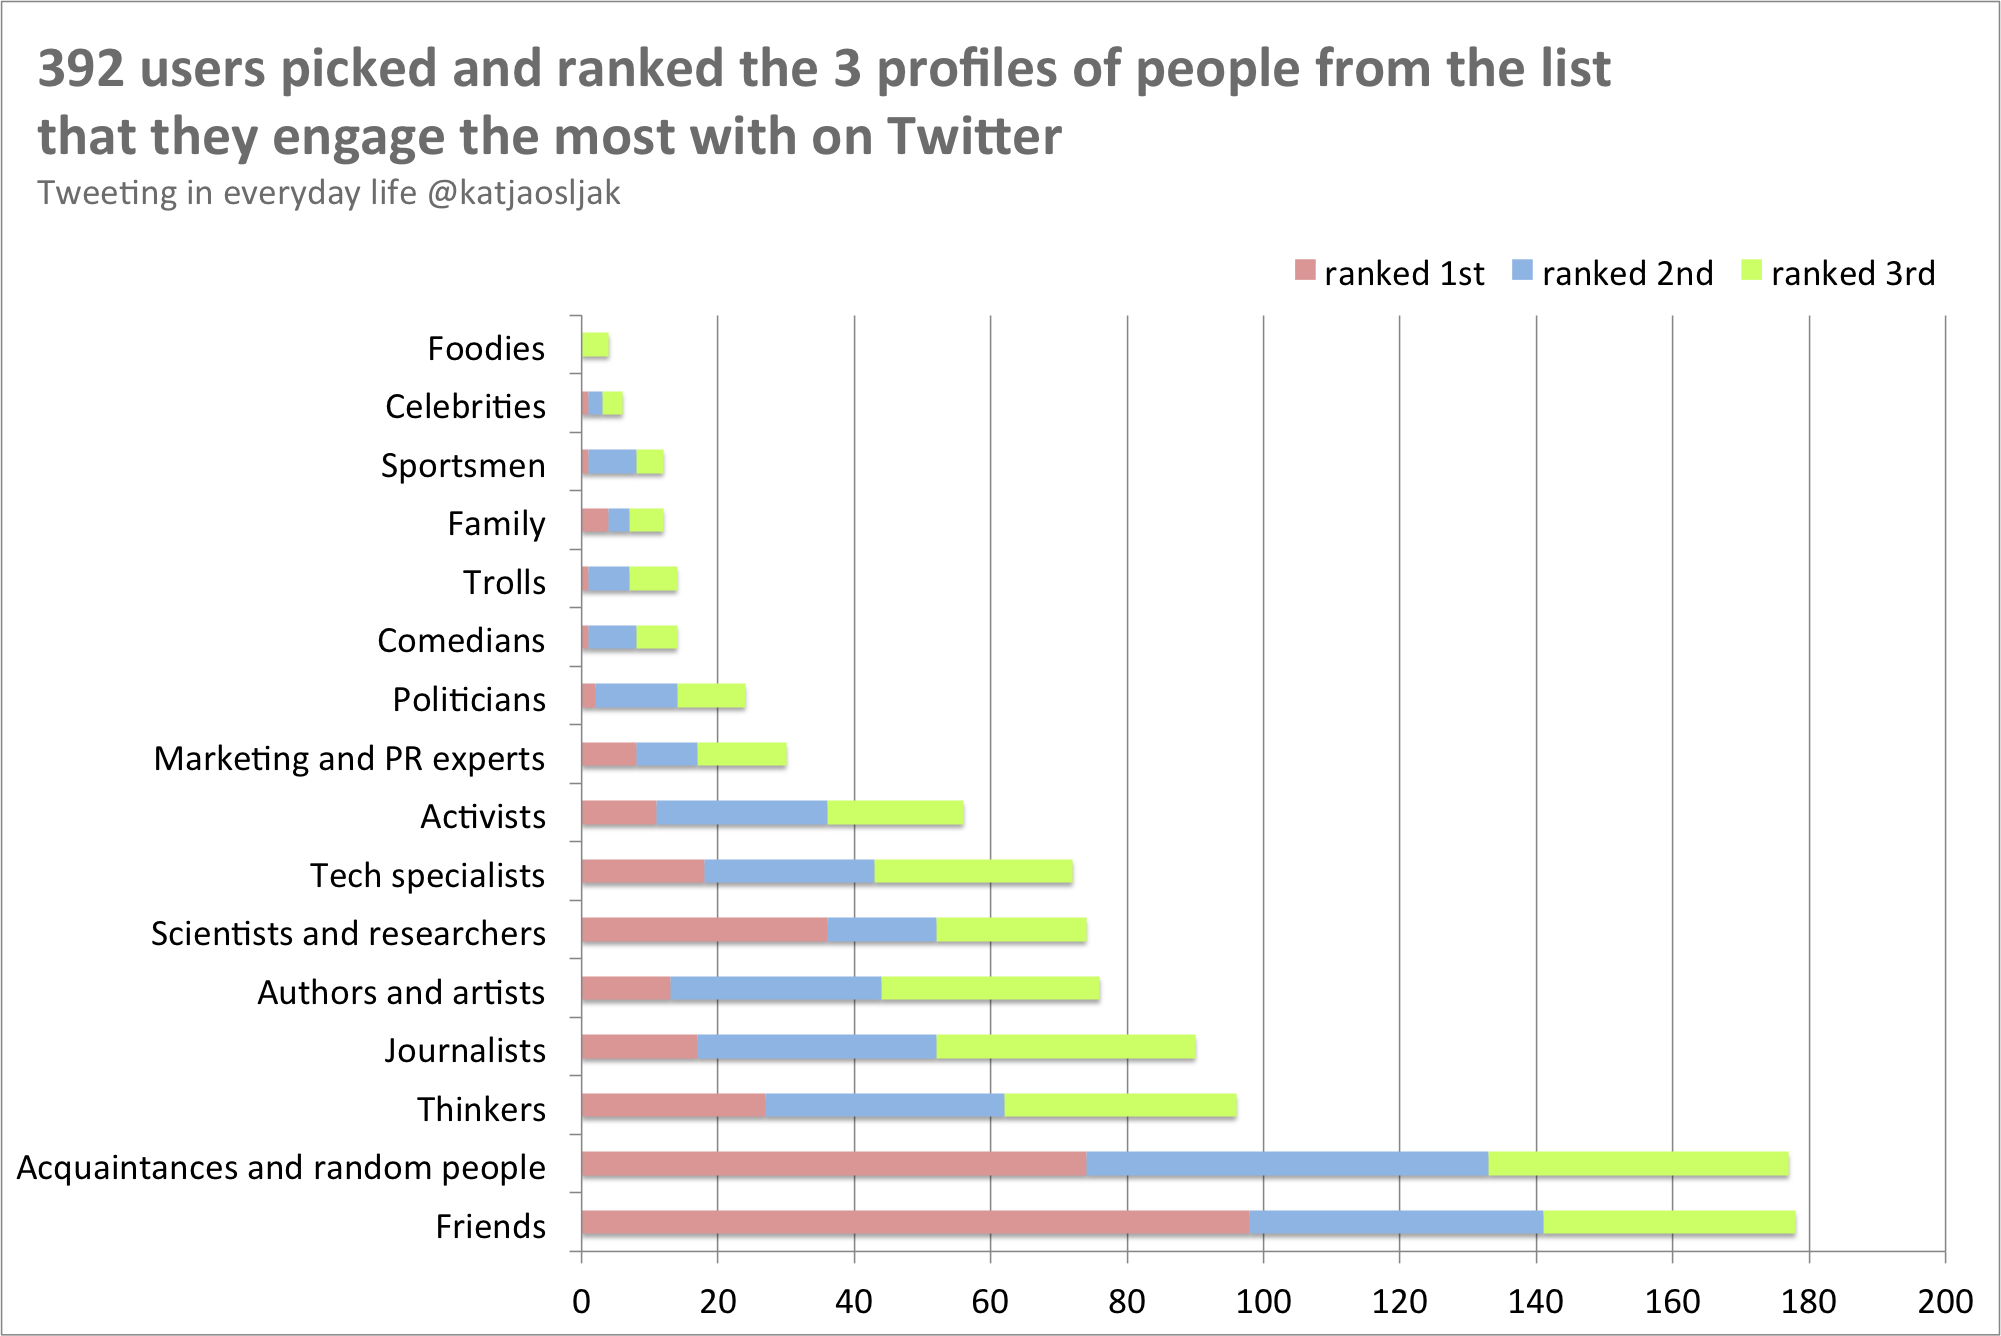
45% users tell that they engage the most with their friends on Twitter and almost as many pick acquaintances and random people. — Those users definitely like to talk about themselves, their life and experience with their friends and acquaintances on Twitter. Traditionally, personal matters among friends have been discussed in private conversations, such as in a living-room, at a table, in a phone call or an e-mail, and the observed relocation of social interactions from private settings to the context of the social network is a typical example of everyday life being mediated on Twitter.
Since when they are tweeting
Users have been answering the question “When did you create your first Twitter account?”. Responses have been accumulated (cumulative frequencies) and visualized in graph, to get a rough picture of how the observed sample has been recruited on Twitter.
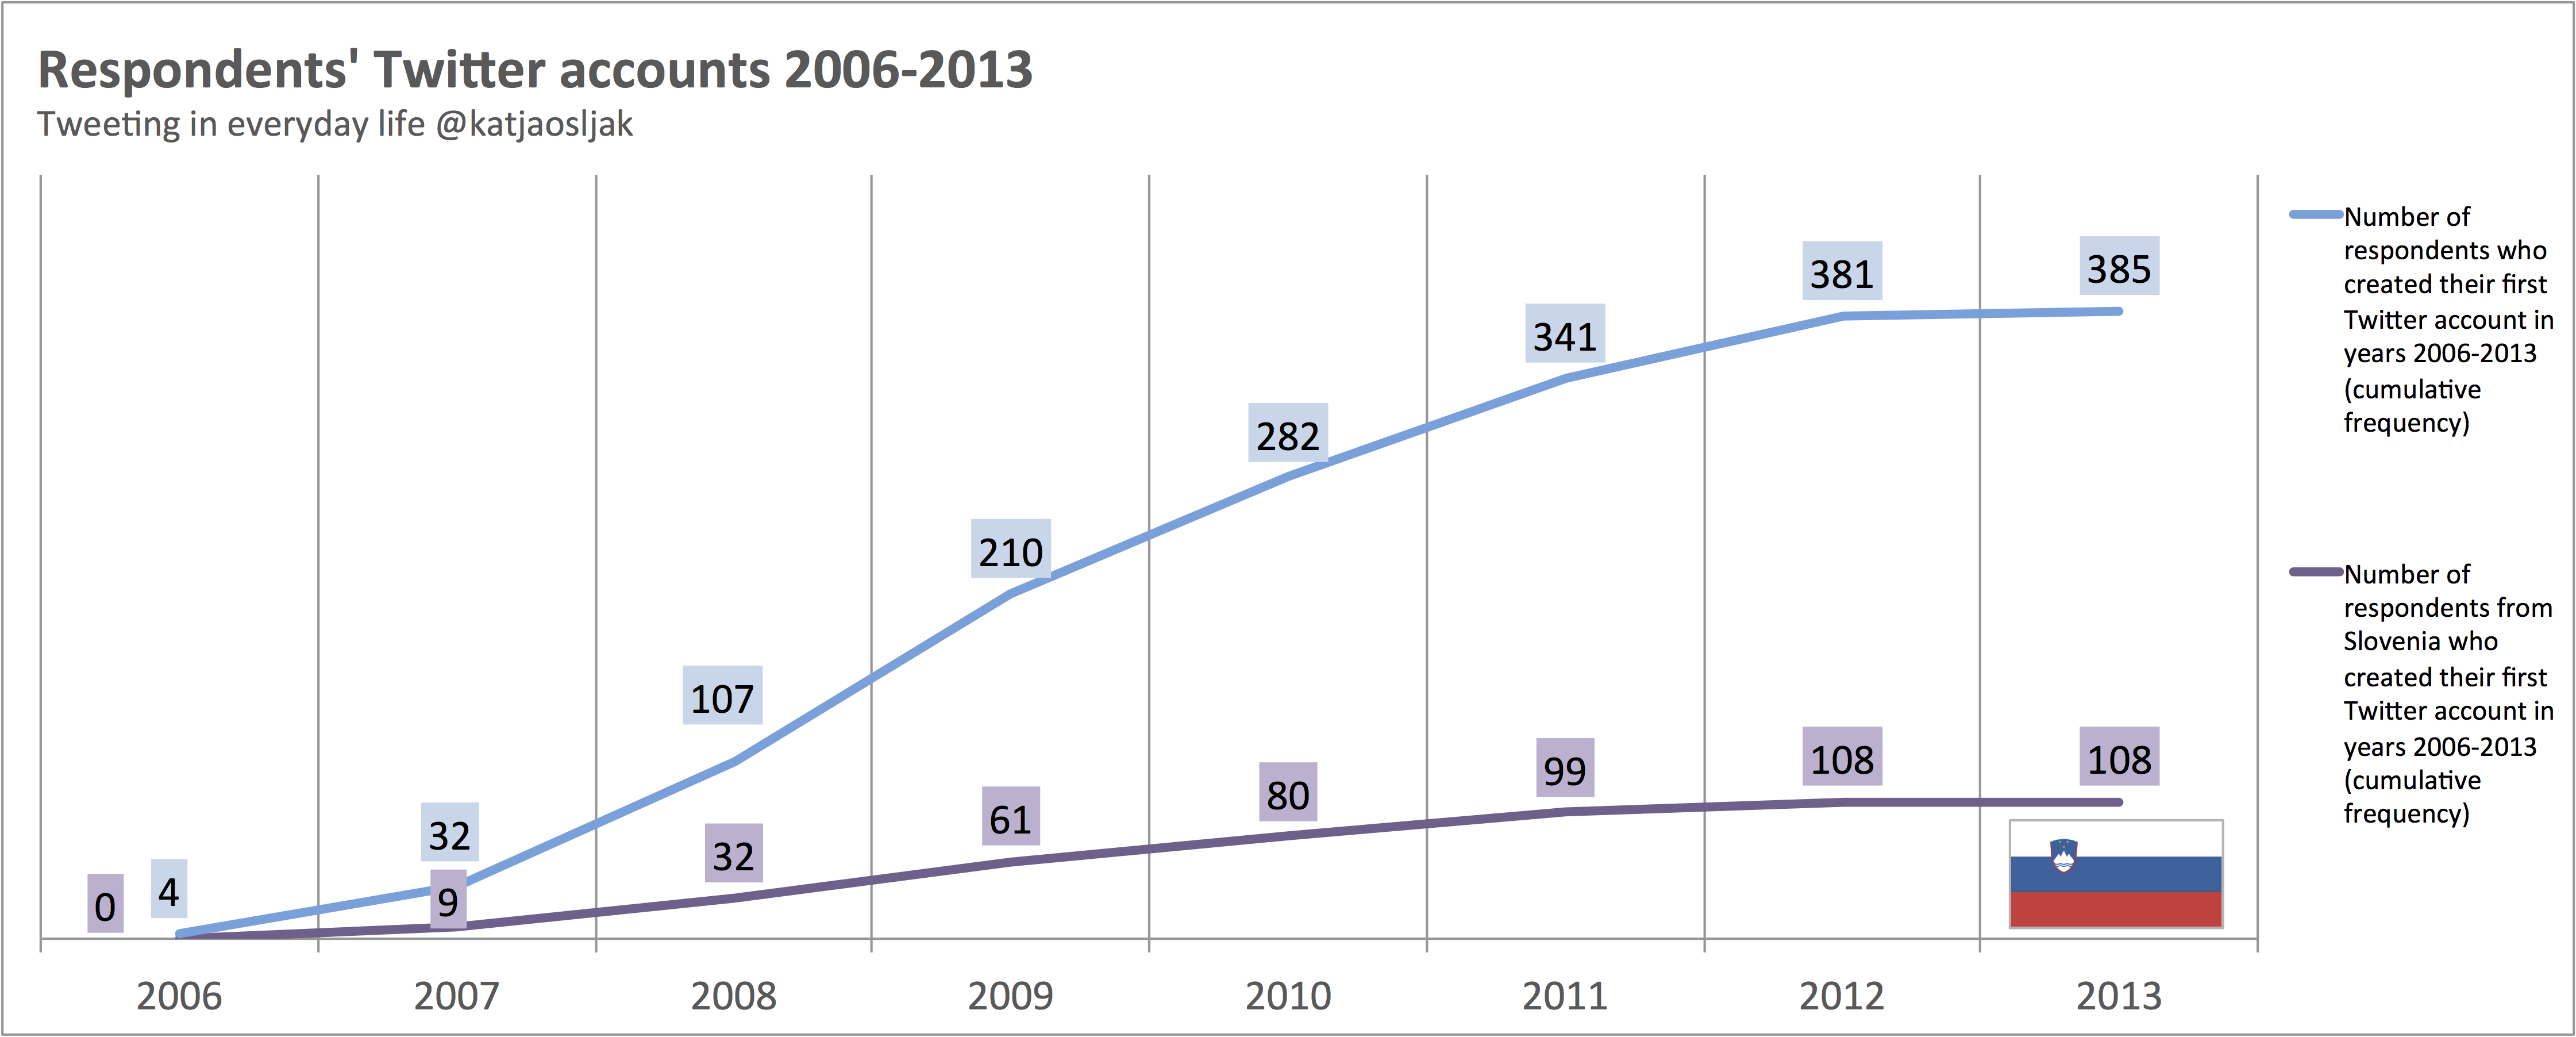
Among the users from the sample 2009 seems to be the year to sign up, since 26% signed up for the service five years ago. In 2008 19% became Twitter users, in 2010 18% of them started using Twitter and in 2011 another 15% signed up for this network. — It’s not exactly the same type of data, but it might be interesting to compare the line of recruitment among the surveyed users with the visualization of Twitter growth.